|
Barn Stall Owner #15
Fantasy Football Champ '11,'13,'17
Points: 49,374, Level: 100 |
Join Date: Jan 2011
Location: Somewhere between mild insanity and complete psychosis.
Posts: 7,972
Thanks: 319
Thanked 2,447 Times in 1,241 Posts
Gameroom Barn Bucks: $1050381
|

I know it's been a while since I did a new one of these. As the election draws closer, I'll be doing more, eventually covering every state I see as an important and winnable swing state, and updating states along the way as we get general election polling. 
For the remainder of my 2012 swing state analysis done so far, check out my quoted posts below:
Quote:
Originally Posted by _Will_

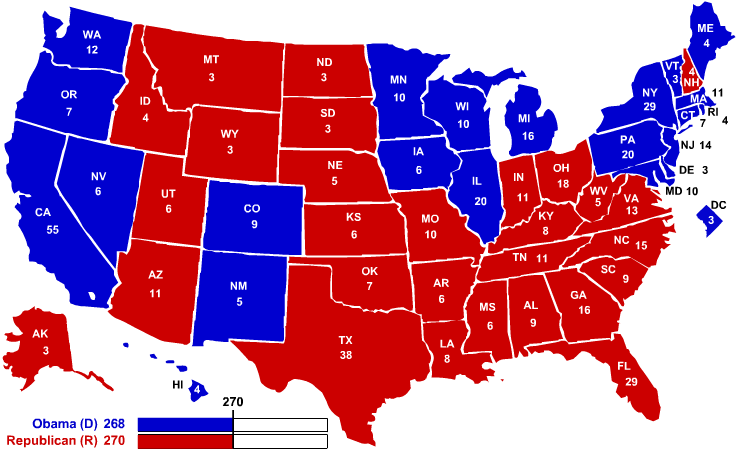
Thanks to the 2010 census and the fact that so many American have fled ****-hole blue states so they could actually find work, the electoral math has swung more in our favor.
Mitt Romney won't even have to win as many swing states as Bush did to win the election.
If Romney can win the McCain states, and regain the South by taking back states like Virginia, Florida, and North Carolina where Obama BARELY won even in the 2008 national landslide, then in order to win the election Romney only needs to win the following additional swing states that Obama won in 2008:
Ohio
Indiana
New Hampshire
Unlike Bush, Romney doesn't need Colorado. He doesn't need Nevada.
Romney can LOSE Nevada, Colorado, New Mexico, and Iowa combined and still win. Bush couldn't.
Important factor to keep in mind. 2012 Electoral math is different than 2000, 2004, and 2008.
Different combinations of states that can give 270 electoral votes, the number needed to win.
Texas +4
Florida +2
Arizona +1
Georgia +1
Nevada +1
South Carolina +1
Utah +1
Washington +1
Illinois -1
Iowa -1
Louisiana -1
Massachusetts -1
Michigan -1
Missouri -1
New Jersey -1
Pennsylvania -1
New York -2
Ohio -2
So, in total the net electoral vote change from 2008 to 2012 is as follows:
Solid Red States +6
Swing States +/-0
Solid Blue States -6
I define "Solid Red" states as states that voted for Bush and McCain in 2000, 2004, and 2008.
"Solid Blue" states went for Gore, Kerry, and Obama in 2000, 2004, and 2008.
Swing states went both ways in that time period.
|
Quote:
Originally Posted by _Will_
Most Likely Romney Bare-Minimum Victory Scenario:
-Romney wins McCain states
-Romney retakes South (where Obama barely won VA, NC, and FL) and Indiana (where Obama barely won)
-Romney wins swing states Ohio and New Hampshire
Additionally, an equally likely bare-minimum scenario is one where Romney takes Nevada (large Mormon Population, worst unemployment rate) instead of New Hampshire. |
Quote:
|
Originally Posted by _Will_
Well, I know some folks appreciated all the poll analysis I did leading up to the 2008 Election.
I had Obama called all the way, and was pretty spot on in my predictions based on the models I used. If I recall correctly, I missed IN and NC, which were dead heats.
It's that time again. This time, I'm starting out with something a little different - ACTUAL real world results.
Taking the popular vote totals from House elections in 2010 in the swing states.
The numbers, quite simply, are SHOCKING.
The Green Papers 2010 U.S. House Popular Vote and FEC Total Receipts by Party
I'll edit this OP and post them up as I tally them.
Here's what I have so far:
Colorado (7 Congressional Districts):
Republicans - 884,032
Democrats - 800,900
Florida (25 Congressional Districts):
Republicans - 3, 028,774
Democrats - 1,896,869
Iowa (5 Congressional Districts):
Republicans - 597,414
Democrats - 479,874
Indiana (9 Congressional Districts):
Republicans - 1,087,967
Democrats - 740,201
North Carolina (13 Congressional Districts):
Republicans - 1,440,913
Democrats - 1,204,635
New Hampshire (2 Congressional Districts):
Republicans - 230,265
Democrats - 200,563
New Mexico (3 Congressional Districts):
Republicans - 289,217
Democrats - 308,473
Nevada (3 Congressional Districts):
Republicans - 357,369
Democrats - 317,835
Ohio (18 Congressional Districts):
Republicans - 2,053,071
Democrats - 1,611,100
Virginia (11 Congressional Districts):
Republicans - 1,186,098
Democrats - 911,116 |
Quote:
Originally Posted by _Will_
Electoral Map in 2012 Presidential Election if the Republican Candidate holds the states McCain won and wins the states House Republicans won in 2010 as listed above:
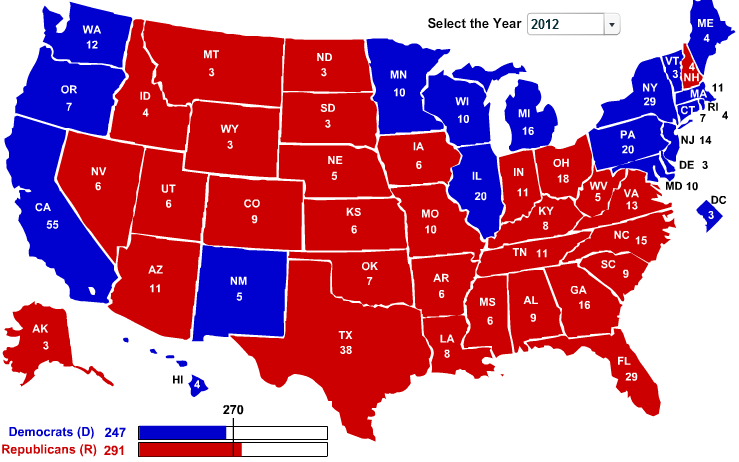 |
Quote:
Originally Posted by _Will_
Man, looking at this new electoral map, there has been a MONUMENTAL shift in terms of Presidential Election politics and strategy.
Everyone has been focusing on the small shift towards Republicans that will result in a few more winnable house seats out of hundreds for them and a few less for Democrats.
But these seemingly minor population shifts and electoral vote total changes are distributed in such a way that the Presidential election consequences are HUGE for Republicans.
Remember, as the 2008 election approached, a BIG problem for McCain was the swing states, ESPECIALLY out west in Colorado, Nevada, and New Mexico. Now in the end, McCain got his clock cleaned and lost states in the South (Florida, Virginia, North Carolina), as well as the pivotal swing state of Ohio, and the elections biggest shocker in Indiana.
But assuming it was closer, Republicans needed to retain the key swing state of Ohio AND win a combination of 2 to 3 of the following 5 swing states: New Hampshire, Iowa, New Mexico, Nevada, and Colordaro.
NOW look at what happens if the Republican candidate in 2012 regains the southern states of VA, NC, and FL (All 3 of which were 50-50 nail biters), regains the state of Indiana, and wins the key swing state of Ohio:

In 2008, this scenario would have the Republican candidate behind by 18 electoral votes. NOW, in 2012, the deficit would only be 4 electoral votes.
This means to go over the top, a Republican candidate would now only need to add ONE, and ANY ONE of the following states: Iowa, New Hampshire, Colorado, New Mexico, and Nevada. Even tiny little New Hampshire's 4 electoral votes would make up the gap.
And, coincidentally, two of these 5 states - Iowa and New Hampshire - are the first primary states.
The Republican party MUST put ADDITIONAL emphasis on these early primaries, not only paying attention to who actually wins them, but to who garners the best poll support among NON-Republican primary voters in those 2 states - specifically moderate dems and INDEPENDENTS.
A candidate who can deliver EITHER state in the general election is a candidate who CAN DEFEAT Barack Obama |
Quote:
Originally Posted by _Will_
IOWA 2008 Election Exit Poll Results (CNN):
Democrats (34% of voters): 93% Obama, 6% McCain
Republicans (33% of voters): 9% Obama, 90% McCain
Independents (33% of voters): 56% Obama, 41% McCain
Local Exit Polls - Election Center 2008 - Elections & Politics from CNN.com
IOWA 2004 Election Exit Poll Results (CNN):
Democrats (34% of voters): 92% Kerry, 8% Bush
Republicans (36% of voters): 7% Kerry, 93% Bush
Independents (30% of voters): 53% Kerry, 45% Bush
CNN.com Election 2004
So....
If we make the CONSERVATIVE assumption that voter turnout among the parties and independents remains the same as in 2008,
and that Obama retains the same level of his party's support,
and The Republican candidate is able to revert to at least Bush 2004 levels of Republican support,
then in order to WIN Iowa, a Republican candidate would need to win the Independent vote against Obama by a margin of 52% to 48%
---------------------------------------------------------------------------------------------------------------------------------------------
IF turnout more closely resembles 2004 with a Republican advantage (more likely scenario) those numbers FLIP!
A republican who loses the independent vote by 48% to 52% to Obama or any gap smaller than that 4%, would WIN Iowa.
.
.
.
|
Quote:
Originally Posted by _Will_
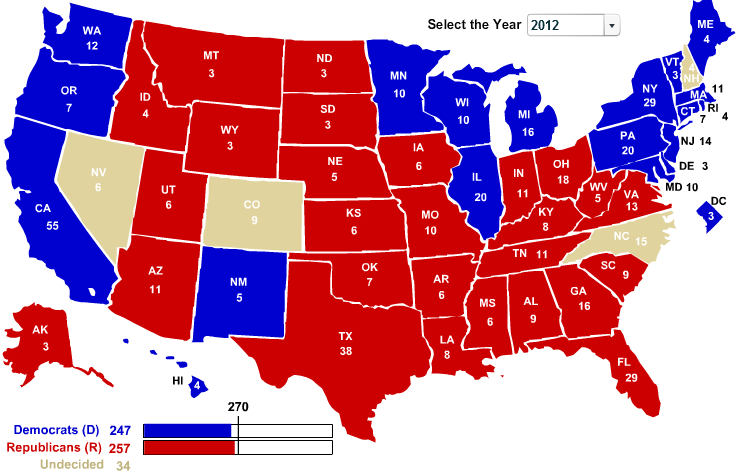
Gap Between Republican Popular Vote and Democratic Popular Vote as a % of the Total Votes Received by Both Parties:
Colorado - 5%
Florida - 23%
Iowa - 10.9%
Indiana - 19%
North Carolina - 9%
New Hampshire - 6.9%
Nevada - 5.9%
Ohio - 12.1%
Virginia - 13.1%
So if we put ONLY the DOUBLE DIGIT victories for Republicans in their column in a hypothetical 2012 Presidential Match-up, place New Mexico in the Democratic column, and place the remaining swing states Republicans only won by single digits as toss-ups, we get the following:
|
Quote:
Originally Posted by _Will_
Add North Carolina to the Republican column in the above scenario, and the Republicans WIN with 2 electoral votes to spare.
Republicans usually win North Carolina in Presidential elections. In Obama's 2008 beat-down of McCain he only won North Carolina by a HAIR:
50% to 49%
2,142,651 votes to 2,128,474 votes.
A 14,177 vote margin of victory out of over 4.2 million total votes.
--------------------------------------------------------------------------
McCain won the independent vote in NC in 2008 60%-40%
Democrats made up 42% of the electorate in NC in 2008 as opposed to 45%
(1) NO WAY the Republicans do any WORSE with independents in NC IMHO.
(2) NO WAY the Democrats match their 2008 turnout and enthusiasm levels IMHO.
|
Quote:
Originally Posted by _Will_
A closer look at COLORADO
2000:
Bush 56% White Vote (81%)
Gore 37% White Vote (81%)
Bush 25% Latino Vote (14%)
Gore 68% Latino Vote (14%)
Bush 13% Democrat Vote (35%)
Gore 83% Democrat Vote (35%)
Bush 95% Republican Vote (36%)
Gore 4% Republican Vote (36%)
Bush 44% Independent Vote (29%)
Gore 39% Independent Vote (29%)
--------------------------------------------------------------------------
2004:
Bush 57% White Vote (86%)
Kerry 42% White Vote (86%)
Bush 30% Latino Vote (8%)
Kerry 68% Latino Vote (8%)
Bush 7% Democrat Vote (29%)
Kerry 93% Democrat Vote (29%)
Bush 93% Republican Vote (38%)
Kerry 6% Republican Vote (38%)
Bush 45% Independent Vote (33%)
Kerry 52% Independent Vote (33%)
--------------------------------------------------------------------------
2008:
Obama defeated McCain 54% to 45%, 1,288,576 to 1,073,589
McCain 48% White Vote (81%)
Obama 50% White Vote (81%)
McCain 38% Latino Vote (13%)
Obama 61% Latino Vote (13%)
McCain 7% Democrat Vote (30%)
Obama 92% Democrat Vote (30%)
McCain 87% Republican Vote (31%)
Obama 13% Republican Vote (31%)
McCain 44% Independent Vote (39%)
Obama 54% Independent Vote (39%)
--------------------------------------------------------------------------
2010:
Republicans defeat Democrats in House races by 5%, 884,032 to 800,900
Democrat Incumbent Senator Michael Bennet defeated Republican challenger Ken Buck 48.1% to 46.4%, 851,590 to 822,731
Michael Bennett(D) 44% Whites (81%)
Ken Buck(R) 51% Whites (81%)
Michael Bennett(D) ??? Latino (12%)
Ken Buck(R) ??? Latino (12%)
Michael Bennett(D) 94% Democrats (33%)
Ken Buck(R) 4% Democrats (33%)
Michael Bennett(D) 10% Republicans (28%)
Ken Buck(R) 89% Republicans (28%)
Michael Bennett(D) 37% Independents (39%)
Ken Buck(R) 53% Independents (39%)
--------------------------------------------------------------------------
If we assume 2012 Voter ID along party lines will look like 2010, and we assume that Obama maintains his level of Democrat support, and we assume that the Republican gets back to 2004 Bush levels of Republican support, in order to win Colorado the Republican would need to win the Independent vote by ~9% to win Colorado.
Republican Senate LOSER Ken Buck won the Independent vote in 2010 by a 16% margin.
If we assume turnout among whites and Hispanics is the same as in 2008, The Republican candidate could win 57% of the White vote, matching Bush's 2004 effort, and 29.5% of the Latino Vote, beating Bush in 2000 but LOSING to McCain in 2008, and top 50% of the total vote and WIN Colorado. |
Quote:
Originally Posted by _Will_
FLORIDA
FLORIDA was the sight of the GOP's greatest victory in 2010. They won the popular vote in House races across the state by a whopping TWENTY THREE PERCENT !!!
Marco Rubio won a Senate seat with the SITTING REPUBLICAN GOVERNOR in the race as an Independent candidate, and with a whopping 48.9% of the vote in a 3 way race.
A ballot measure calling for a federal balanced budget amendment passed with 71.9% in favor.
Even Rick Scott, political newbie and WELL documented douche-bag and leader of a company that DEFRAUDED Medicare, managed to win the race for governor over known quantity, state attorney Alex Sink.
Florida - Election Results 2010 - The New York Times
And, again, I hate to beat a dead horse, but in an absolute BEAT DOWN of an election for Obama, he ONLY managed even 51% of the vote in 2008, defeating McCain 4,282,074 votes to 4,045,624 votes.
Local and National Election Results - Election Center 2008 - Elections & Politics from CNN.com
Florida 2012 STATUS for Republicans - WINNABLE
|
|

 02-18-2012, 5:23pm