|
Barn Stall Owner #15
Fantasy Football Champ '11,'13,'17
Points: 49,374, Level: 100 |
Join Date: Jan 2011
Location: Somewhere between mild insanity and complete psychosis.
Posts: 7,972
Thanks: 319
Thanked 2,447 Times in 1,241 Posts
Gameroom Barn Bucks: $1050381
|

Some background since I started doing this years ago on another forum:
Quote:
Originally Posted by _Will_

Keep in mind, my calculations are based off of AVERAGES over time. Just as now, in past recessions there have been temporary decreases in the middle of the overall trend of increasing unemployment.
Lets go to the recent recessions we are using to model unemployment this recession.
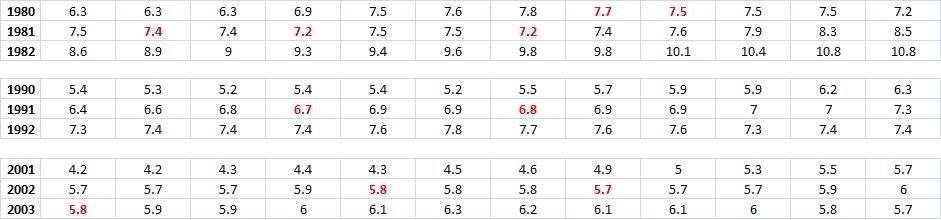
The 1980 recession. As stated earlier, unemployment increased on average .14% per month from the peak of the recession in 1980 until peak unemployment in 1982.
However within that unemployment growth spurt there were temporary decreases, probably also due to calculation methods, people leaving the workforce, etc.
The same for all 3 recessions. The bold red numbers represent months where we experienced temporary decreases within the broader trend:
 |
Just a refresher, the historical basis of our calculations and mapping:
Quote:
|
Originally Posted by _Will_
To recap the unemployment calculations I have done:
Unemployment Rate hits 9.4% in May, new projections calculated for future. - Corvette Forum
Quote:
|
Originally Posted by _Will_
Updated the unemployment projections based on May's numbers and once again, a best case scenario:
|
Quote:
|
Originally Posted by _Will_
At the beginning of the year, I examined past unemployment trends coinciding with recessions and made a best-case scenario prediction assuming Q4 was the peak of negative growth:
Unemployment Rate at 8.5% - Corvette Forum |
Quote:
Originally Posted by _Will_
Peak unemployment as of a result of the 2000-2001 recession hit 6.3% in June 2003. It took exactly two years to drop by 1.3% back to 5% unemployment, or .05% per month.
Peak unemployment as a result of the 1990-1991 recession hit 7.8% in June 1992. It took 4 years and 11 months to hit full employment again, again dropping by .05% per month.
Peak unemployment as a result of the 1980-1982 recession hit 10.8% in November 1982. It took 6 years and 4 months to drop to full employment again, dropping by .07% per month.
If March represented the peak of unemployment and we began the turnaround in employment right now, by November 2012 the unemployment rate would be ~6.3 or 6.4%, exactly what is was at election day 2008.
We would not hit full employment again until ~January 2015.
|
Quote:
Originally Posted by _Will_
The problem is this:
Unemployment hit its peak in June 2003, ~2 years after the negative peak of GDP in Q3 2001.
Unemployment hit its peak in June 1992, ~1.5 years after the peak of negative GDP in Q4 1990.
Unemployment hit its peak in November 1982, ~2.5 years after the negative peak of GDP in Q2 1980
|
|
My VERY FIRST prediction from April 2009 based on my Model:
Quote:
Originally Posted by _Will_
The problem is this:
Unemployment hit its peak in June 2003, ~2 years after the negative peak of GDP in Q3 2001.
Unemployment hit its peak in June 1992, ~1.5 years after the peak of negative GDP in Q4 1990.
Unemployment hit its peak in November 1982, ~2.5 years after the negative peak of GDP in Q2 1980
As we can see the length of time is positively correlated to the severity and length of the recession. 1990 was mild, 2000 somewhat mild, 1980 awful.
So even if we assume for this recession, despite its severity, a period of 1.5 years between peak GDP contraction and peak unemployment, and we assume that we hit the negative peak of GDP contraction in q4 last year, the best case scenario would be for unemployment to continue to rise until summer 2010.
From the peak of negative GDP in 1980 until peak unemployment in 1982, unemployment increased on average ~ 0.14% per month.
From the peak of negative GDP in 1990 until peak unemployment in 1992, unemployment increased on average ~ 0.09% per month.
From the peak of negative GDP in 2001 until peak unemployment in 2003, unemployment increased on average ~ 0.08% per month.
So....
If we assume the best case scenario that Q4 last year was the peak of negative GDP, and....
We assume the best case scenario of only 1.5 years until peak unemployment as in the early 1990s, and....
We assume the best case of unemployment growth of .08% per month as in the early 2000s, and....
We assume the best case scenario of unemployment decreases of .07% per month as in the 1980s....
We will hit peak unemployment around April or May 2010, and the peak unemployment rate at that time will be ~ 9.5%.
By November 2012 unemployment will be ~7.5%
We will reach full employment again around Q3 2015.
|
Corvette Forum - View Single Post - Unemployment Rate at 8.5%
Compare my predictions from APRIL 2009 to the picture at the top of this post. 
MUCH better than the administration's predictions over time, although using my BEST CASE SCENARIO model I UNDERESTIMATED peak unemployment.
|